Simulation help: Interpreting the results
The results are shown in a relative fashion. This is to show how each queue performs compared to others.
Loss and Delay are displayed independently, but the same mechanism is used for both. The traffic that suffered the (absolutely) largest delay (or loss) is taken as peak for the scale. Its delay is shown as 100%. The other delays are then expressed as a percentage of that highest delay.
Because the delay numbers are the result of a simulation based on random numbers, the results are influenced by change. One simulation could result in values better then the "true" expected value; an other one could lead to worse results. Therefor, replications can be made. These results in multiple values and a certain sample mean. This sample mean is shown as a small horizontal line. The standard deviation is used to calculate a confidence interval, which has a high (95%) probability of containing the true expected value. These intervals are shown as vertical bars.
Because the sample mean is used to calculate the 100% value, the vertical bar showing the confidence interval can extend over the 100% point.
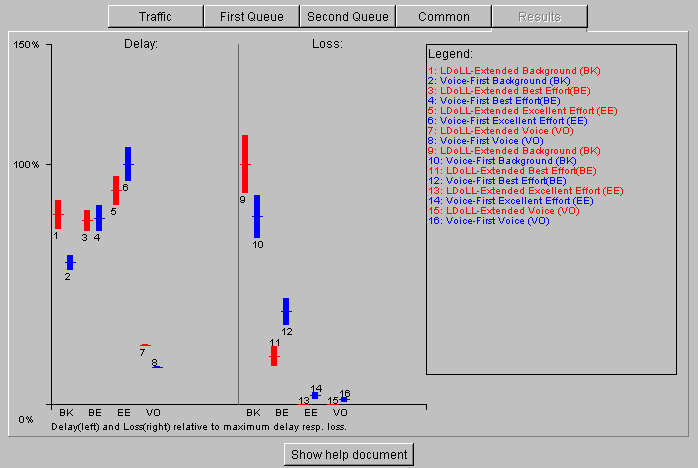
The legend shows the names of the queues and the traffic type of each bar. These are numbered to simplify lookup. Also, the legend is printed using the same colors as the corresponding bars. Each pair of bars shows the delay or loss on one traffic type, respectively for the first Queue and the second queue.
Beside that, the classifications "Loss" and "Delay" are reprinted on top of the graph. At the bottom, the two-letter class code of every group of two bars is indicated.
The last distinction to be made is between the two (different) queue's, and is done using different colors for each queue.
When numeric results are required, you can open your browsers Java window. With Microsoft’s Internet explorer, this is called the "Java Console". It can be found under "View->Java Console". The Java console must be turned on, if not the preference of the browser must be changed and the computer restarted.
With Netscape, this command can be found under "Communicator->Tools->Java Console" or "Communicator->Java Console". Other browser will have a similar option somewhere in the menu.
When the simulation is completed, the applet makes some "sanity check". Since all queues are work conserving, the average losses for both queues should be the same. Of course, that requires that both queues use the same buffer size.
When only simulating a short time period, loss rates and especially delays can differ to much for the sanity check. That will result in a warning being printed on the Java Console.
Because some combinations of priorities and traffic types result in small packets receiving better service the average delays do not need to be the same for both queues. Therefore it is possible that the "sanity check" fails without a good reason. To recognize this situation requires the person using the applet to remember that simulation is only a tool with limitations.
A part of the text printed on the Java console is reproduced below, together with comments. The original text from the Java console is shown in this font
===============
Background (BK)
After the double line, the traffic name is printed
After that, the measurements are printed for both queues. Of course, the queue name is printed first
LDoLL-Extended
Arrivals: 11449740
Serviced: 9124912
Dropped: 2317282
The number of bytes that respectively arrived at the queue, the number that was serviced, and the number that was dropped. The difference between the sum of the dropped and serviced and the arrived counts is the number of bytes that was still in the queue when the simulation was stopped. The packets still in the queue are not used for any measurement.
Average Delay:9.994313137495065E-4 Confidence:9.532161712675175E-5
Average Loss: 0.20375036207655536 Confidence:0.031147121532139666
Peak Delay: 0.007989506775335498 StdDev (Jitter)0.0010312801057140758
The average delay and loss as measured during simulation. Delay is measured in seconds, loss as a portion (thus always between zero and one. The confidence values indicate the 95% confidence interval. These values are not relative, but absolute. Thus they must be added or subtracted from the average values to obtain the borders or the confidence interval
The highest delay measured and the Standard Deviation of the delay are also printed. The peak delay is of limited use, since only one delayed packet can cause a high value here. The standard deviation gives some idea of the variation in the delay. Variation in delay is also known as jitter.
Voice-First
Arrivals: 11449740
Serviced: 9636048
Dropped: 1810864
Average Delay:7.429521621645834E-4 Confidence:4.573061465831963E-5
Average Loss: 0.1587790573376494 Confidence:0.02204319671558748
Peak Delay: 0.004805758084048744 StdDev (Jitter)7.13955823486995E-4
===============
Sanity check:
===> WARNING: Average delays are not equal within 1%
td1: 34382.110381280414 td2: 32471.016165268557 diff: 0.05885538679433111
The last lines show that one of the checks made in the "Sanity Check" failed. The reason the check failed is shown, together with the values that caused the check to fail. In this case, the check failed because the average delays differ 5% instead of less than 1%. This was (in this case) caused by a too short simulation. (A difference of less than 1% is accepted, as it can because by random effects or packets not yet serviced.)
Back to top
Copyright © 2000 Philips Business Communications, Hilversum, The Netherlands.
See legal statement for details